2-Channel EEG Neurofeedback
Tim ErwinMarch 2024
Summary
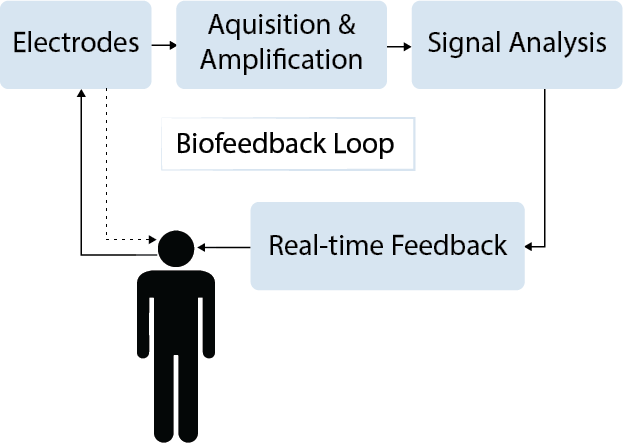
This project is an EEG-based neurofeedback system which provides users with real-time feedback on their level of focus or relaxation. By analyzing the spectral content of the brain activity measured via scalp electrodes, focus and relaxation levels can be quantified. Based on these measurements, live feedback in the form of moving bar graphs is provided to users, allowing them to gain awareness of their mental state and more efficiently learn how to consciously relax or focus. This project covers the design of the system, including amplification and filtering stages, digitization, and signal processing. The system interfaces with a PC, displaying the real-time brain activity and a visual representation of relaxation and concentration levels.
Background
Electroencephalography (EEG), is a method of recording the electrical activity of the brain, typically with non-invasive scalp electrodes. The electrical signals captured via the electrodes are due to the postsynaptic potentials of neurons in the brain, and can be analyzed based on frequency composition and the specific brain regions associated with the originating activity.
The frequencies present in EEG are categorized into the following bands: delta (less than 4 Hz), theta (4-8 Hz), alpha (8-12 Hz), beta (12-30 Hz), and gamma (30-100 Hz). Each of the brainwave frequency ranges provide insights on specific physiological functions, and by measuring the relative power of the frequency ranges, changes in mental states can be quantified. The neurofeedback system presented in this work aims to provide quantified relaxation and concentration values to be used in training attention and stress reduction. The key frequency bands of interest for this system are theta, alpha, and beta. Beta frequencies, associated with increased cognitive activity and concentration, can be broken into three sub-bands to allow for differentiation between relaxed focus and stress. Theta frequencies are linked to deep relaxation and sleep, while alpha frequencies represent alertness and peacefulness. Most neurofeedback techniques for training relaxation involve encouraging low-frequency bands and reducing the activity of higher frequencies during relaxation, without encouraging very low frequencies (theta), to the point of falling asleep. When training concentration, the goal is to increase the activity of higher frequencies.
| Brainwave Type | Frequency | Mental State |
|---|---|---|
| Theta | 4-8 Hz | Deep relaxation, light sleep |
| Alpha | 8-12 Hz | Alert relaxation |
| Low Beta | 12-15 Hz | Relaxed focus |
| Mid Beta | 15-20 Hz | Thinking |
| High Beta | 20-30 Hz | Alertness, agitation |
Summary of EEG frequency bands
System Architecture

High-level Block Diagram
Due to the small amplitude of voltages detectable by scalp electrodes (10-100μV), amplification and
filtering are necessary before digitizing and analyzing brain activity. Based on the smallest expected signal amplitude and assuming an ADC full scale range of around 1V, the system is required to provide a total gain of around 100,000. Filtering is crucial to reduce the strong 60Hz interference from parasitic capacitive coupling to nearby power sources. After digitizing with an ADC, the data is processed to generate live visual feedback of concentration, relaxation levels, and brain activity.
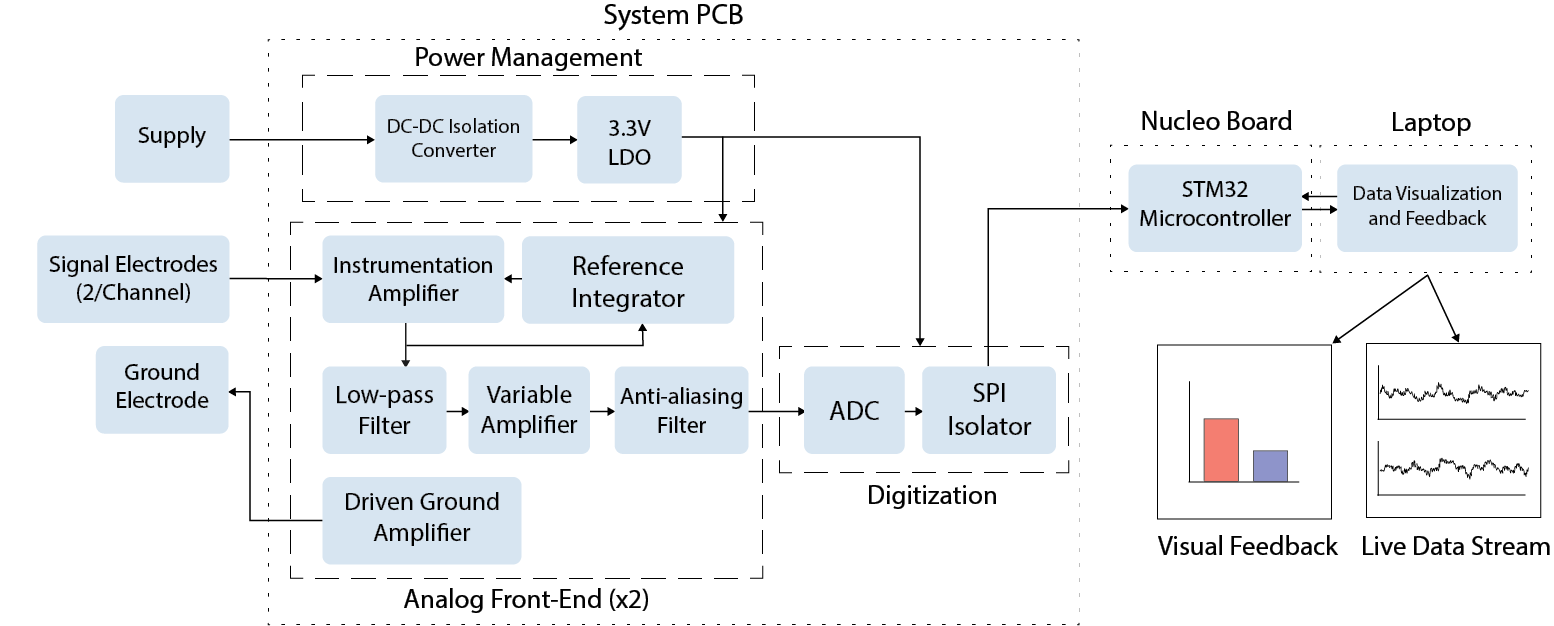
Detailed System Diagram
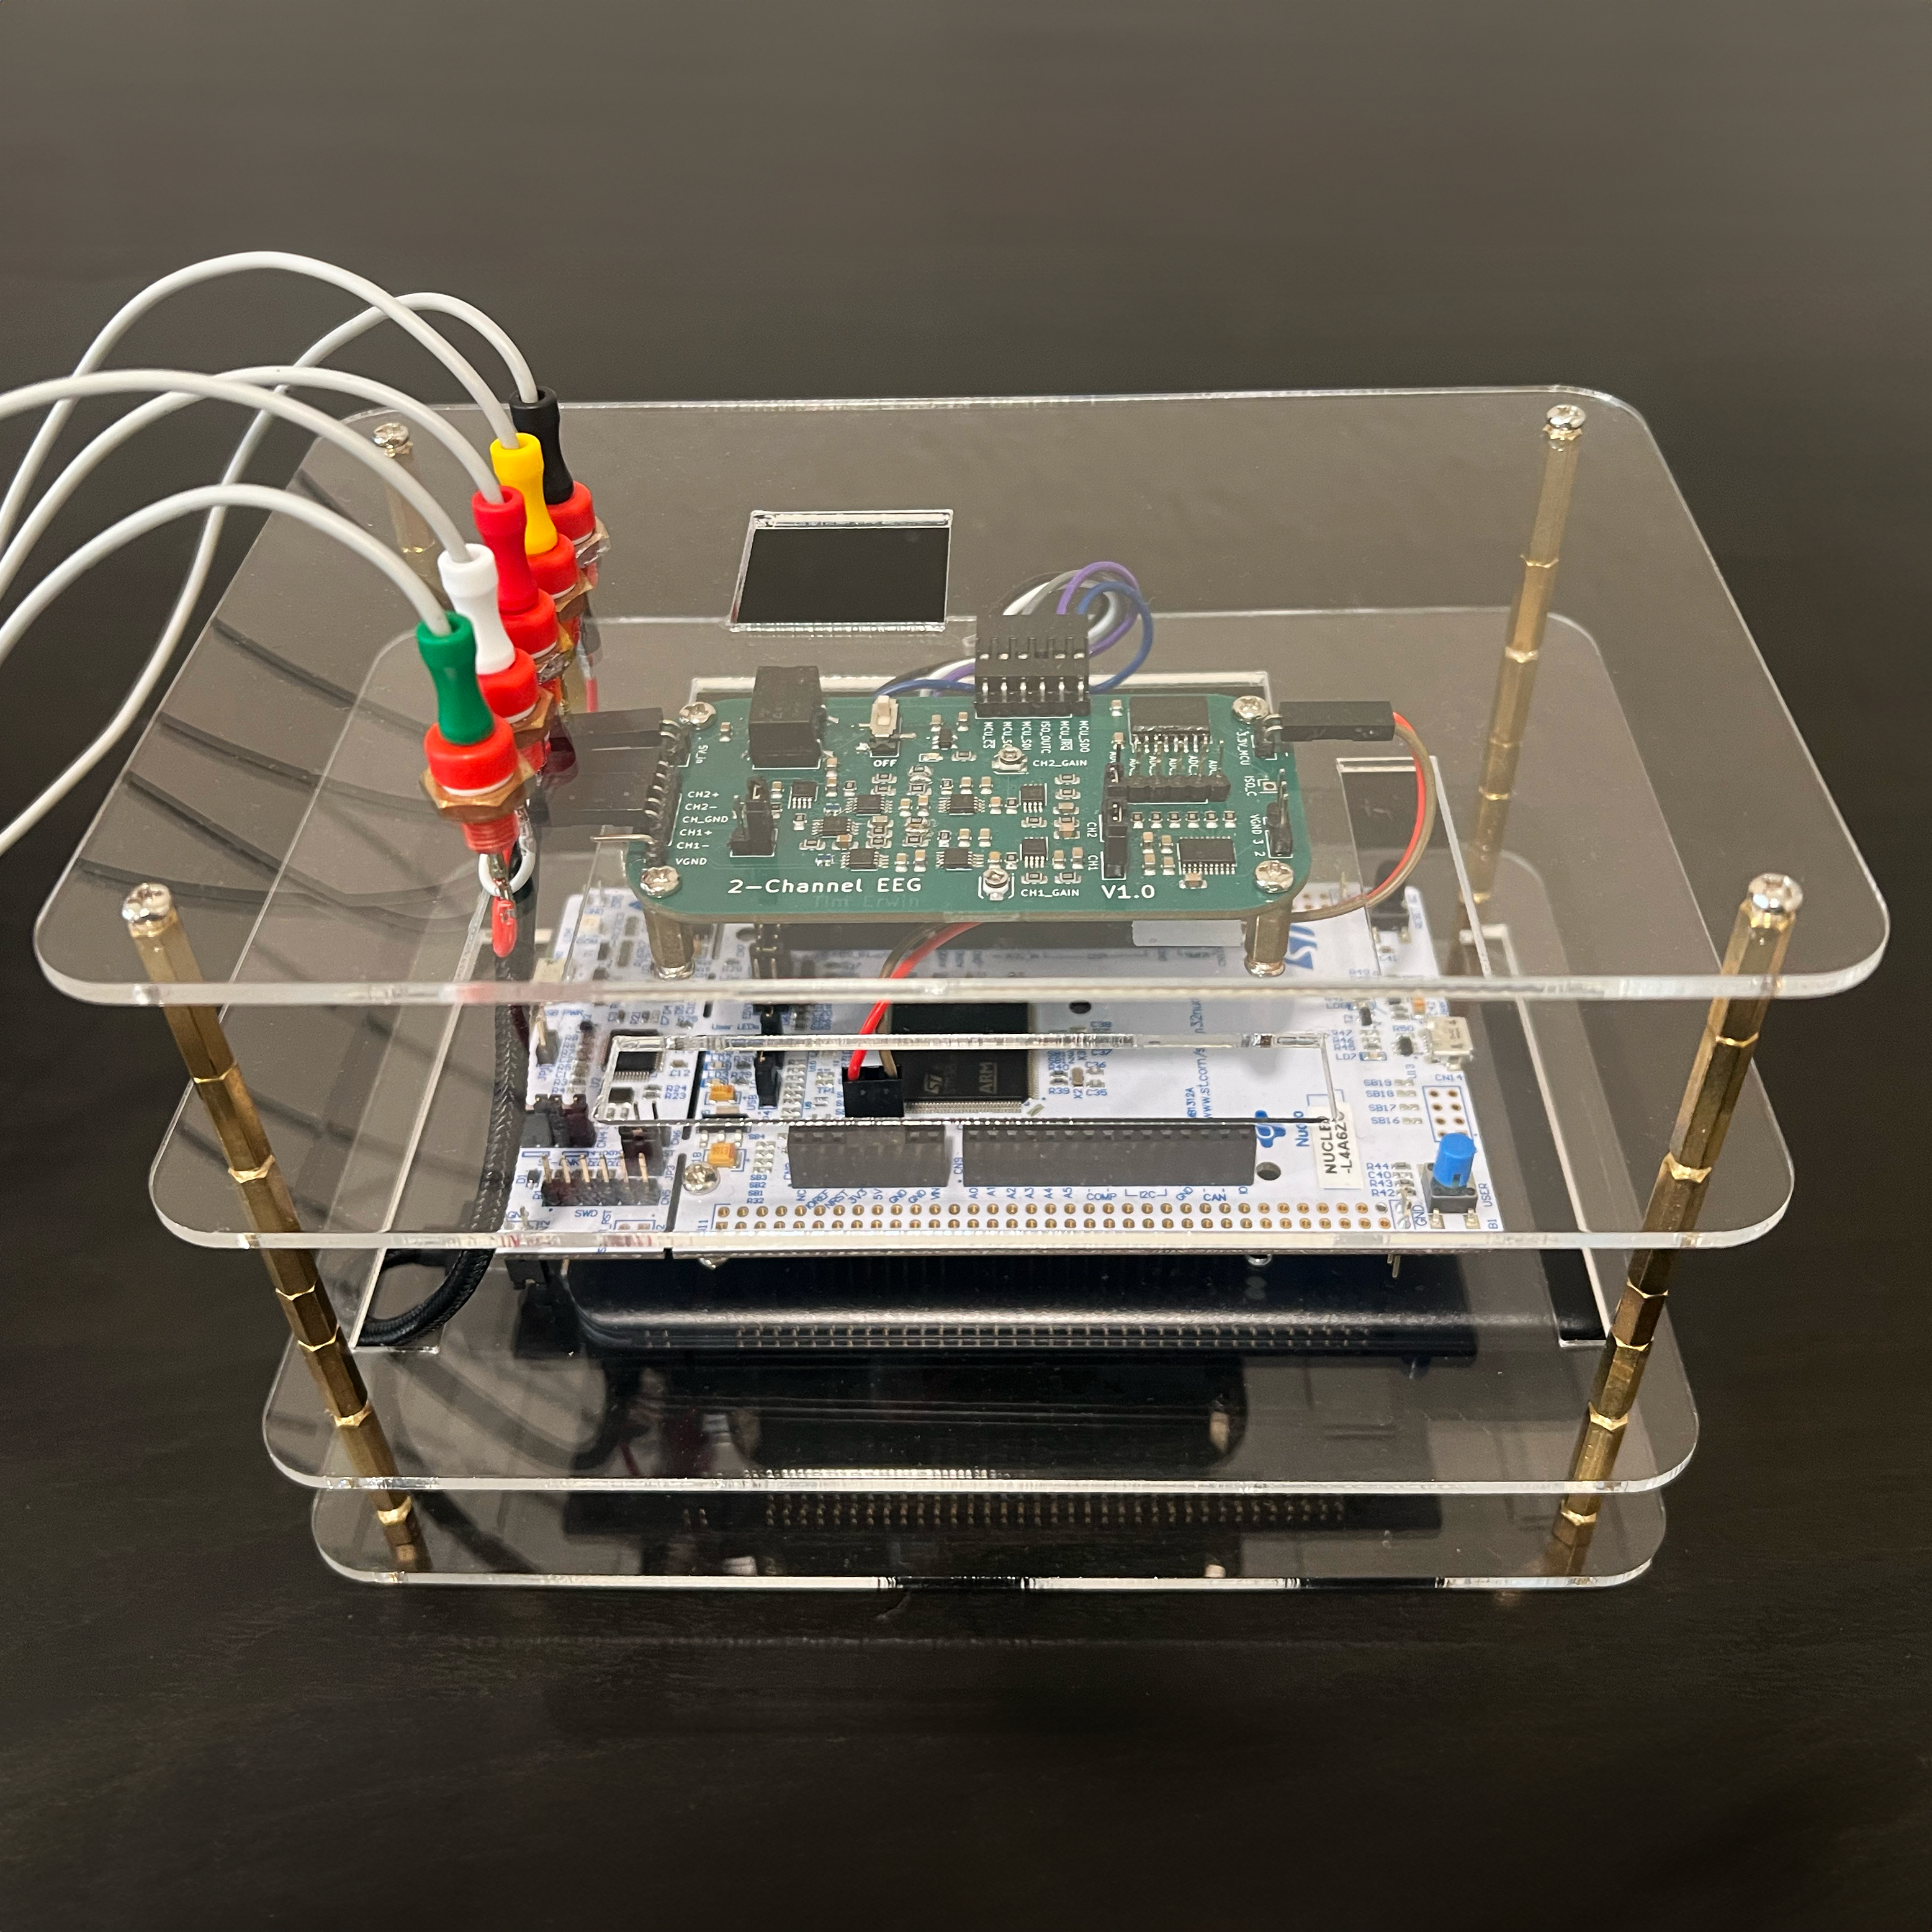
The circuits for power management, amplification, filtering, and digitization are integrated into a custom PCB. Data from the PCB is sent to an STMicroelectronics STM32 NUCLEO-L4A6ZG development board, connected to the user's laptop. The visual feedback and live data stream are displayed on the laptop.
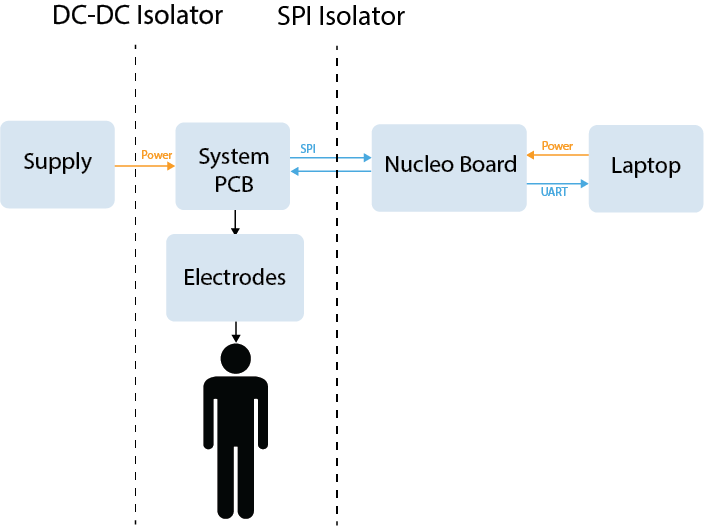
Electrical Isolation Diagram
To ensure the user’s safety, the system PCB is electrically isolated to prevent the flow of potentially harmful currents between the user and other parts of the system. The figure above shows the location of the isolators in relation to the system. The PCB is galvanically isolated from the power supply by a DC-DC isolation converter, and from the laptop using a digital SPI isolator. This prevents the user from being exposed to any high voltages present at the power supply or laptop’s AC adapter.
Electrodes
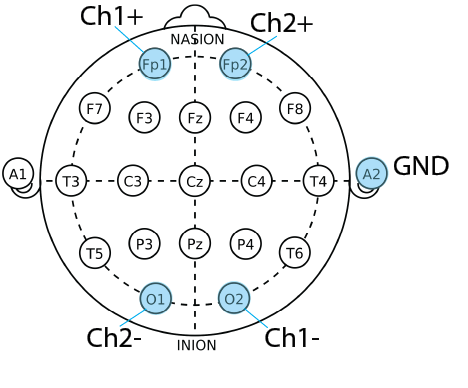
Electrode Placement Diagram
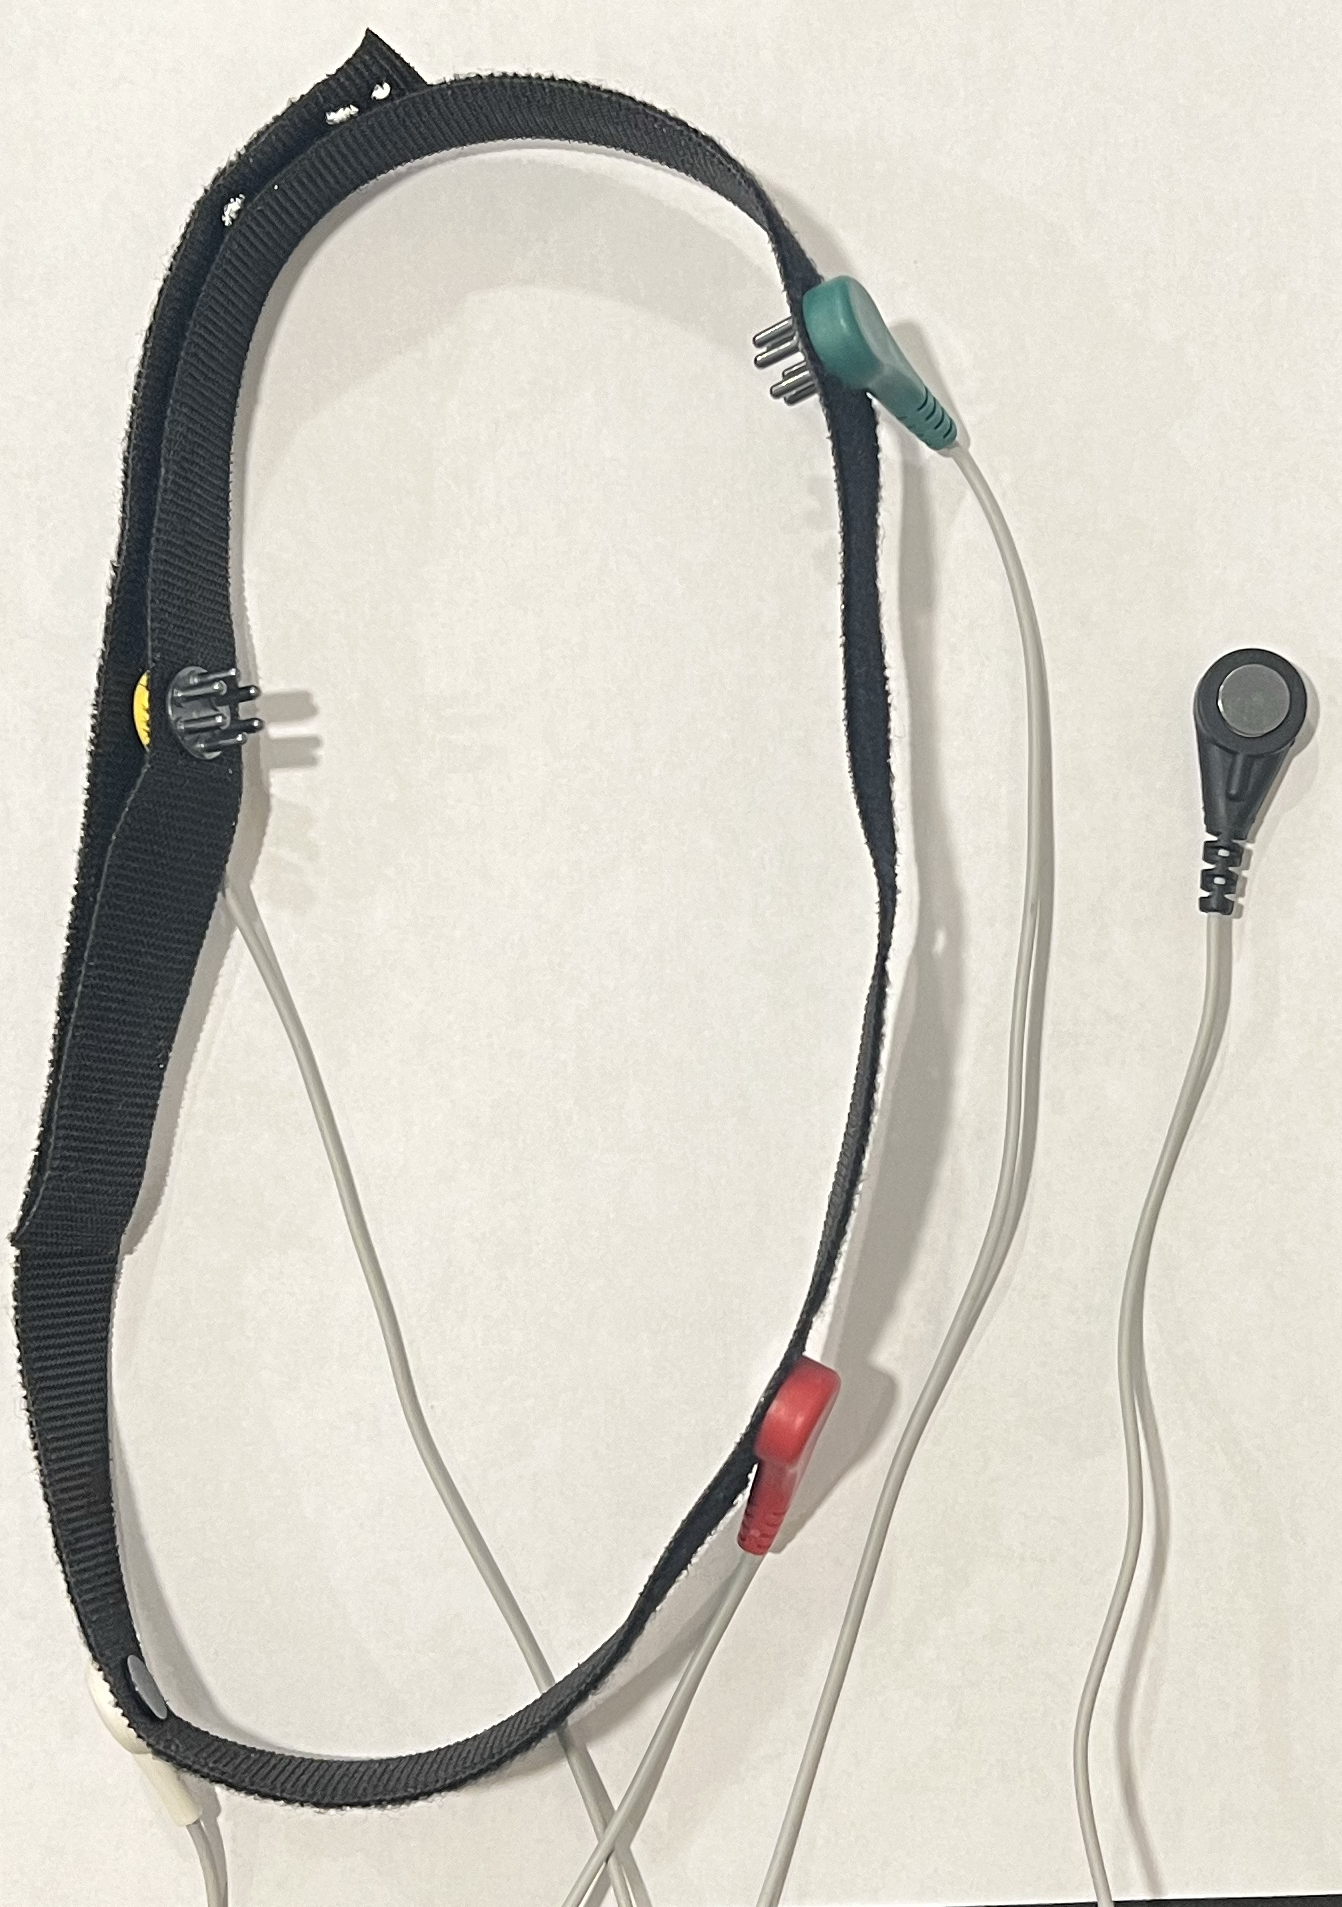
Electrodes and custom VELCRO headband
Silver chloride coated silver (Ag/AgCl) electrodes were chosen due to their availability, low impedance, and low polarization. The low polarization aspect of the electrodes is beneficial due to preventing the buildup of charge on the electrodes, which can generate artifacts and distort the EEG signal.
Electrode positions Fp1, O1, Fp2, and O2 were chosen for the signal electrodes of each channel for a broad picture of the brain and to capture activity in the alpha and beta bands. Beta is commonly found in the front of the brain, and alpha in the back. For user comfort, flat electrodes are used on the forehead, and comb electrodes are used on the back of the head. A flat electrode is placed behind an ear on the mastoid for grounding, a common location due to the absence of strong brain activity signals. Conductive electrode gel is applied to the electrodes before placing them on the user’s head to improve electrical contact with the skin.
Hardware Design
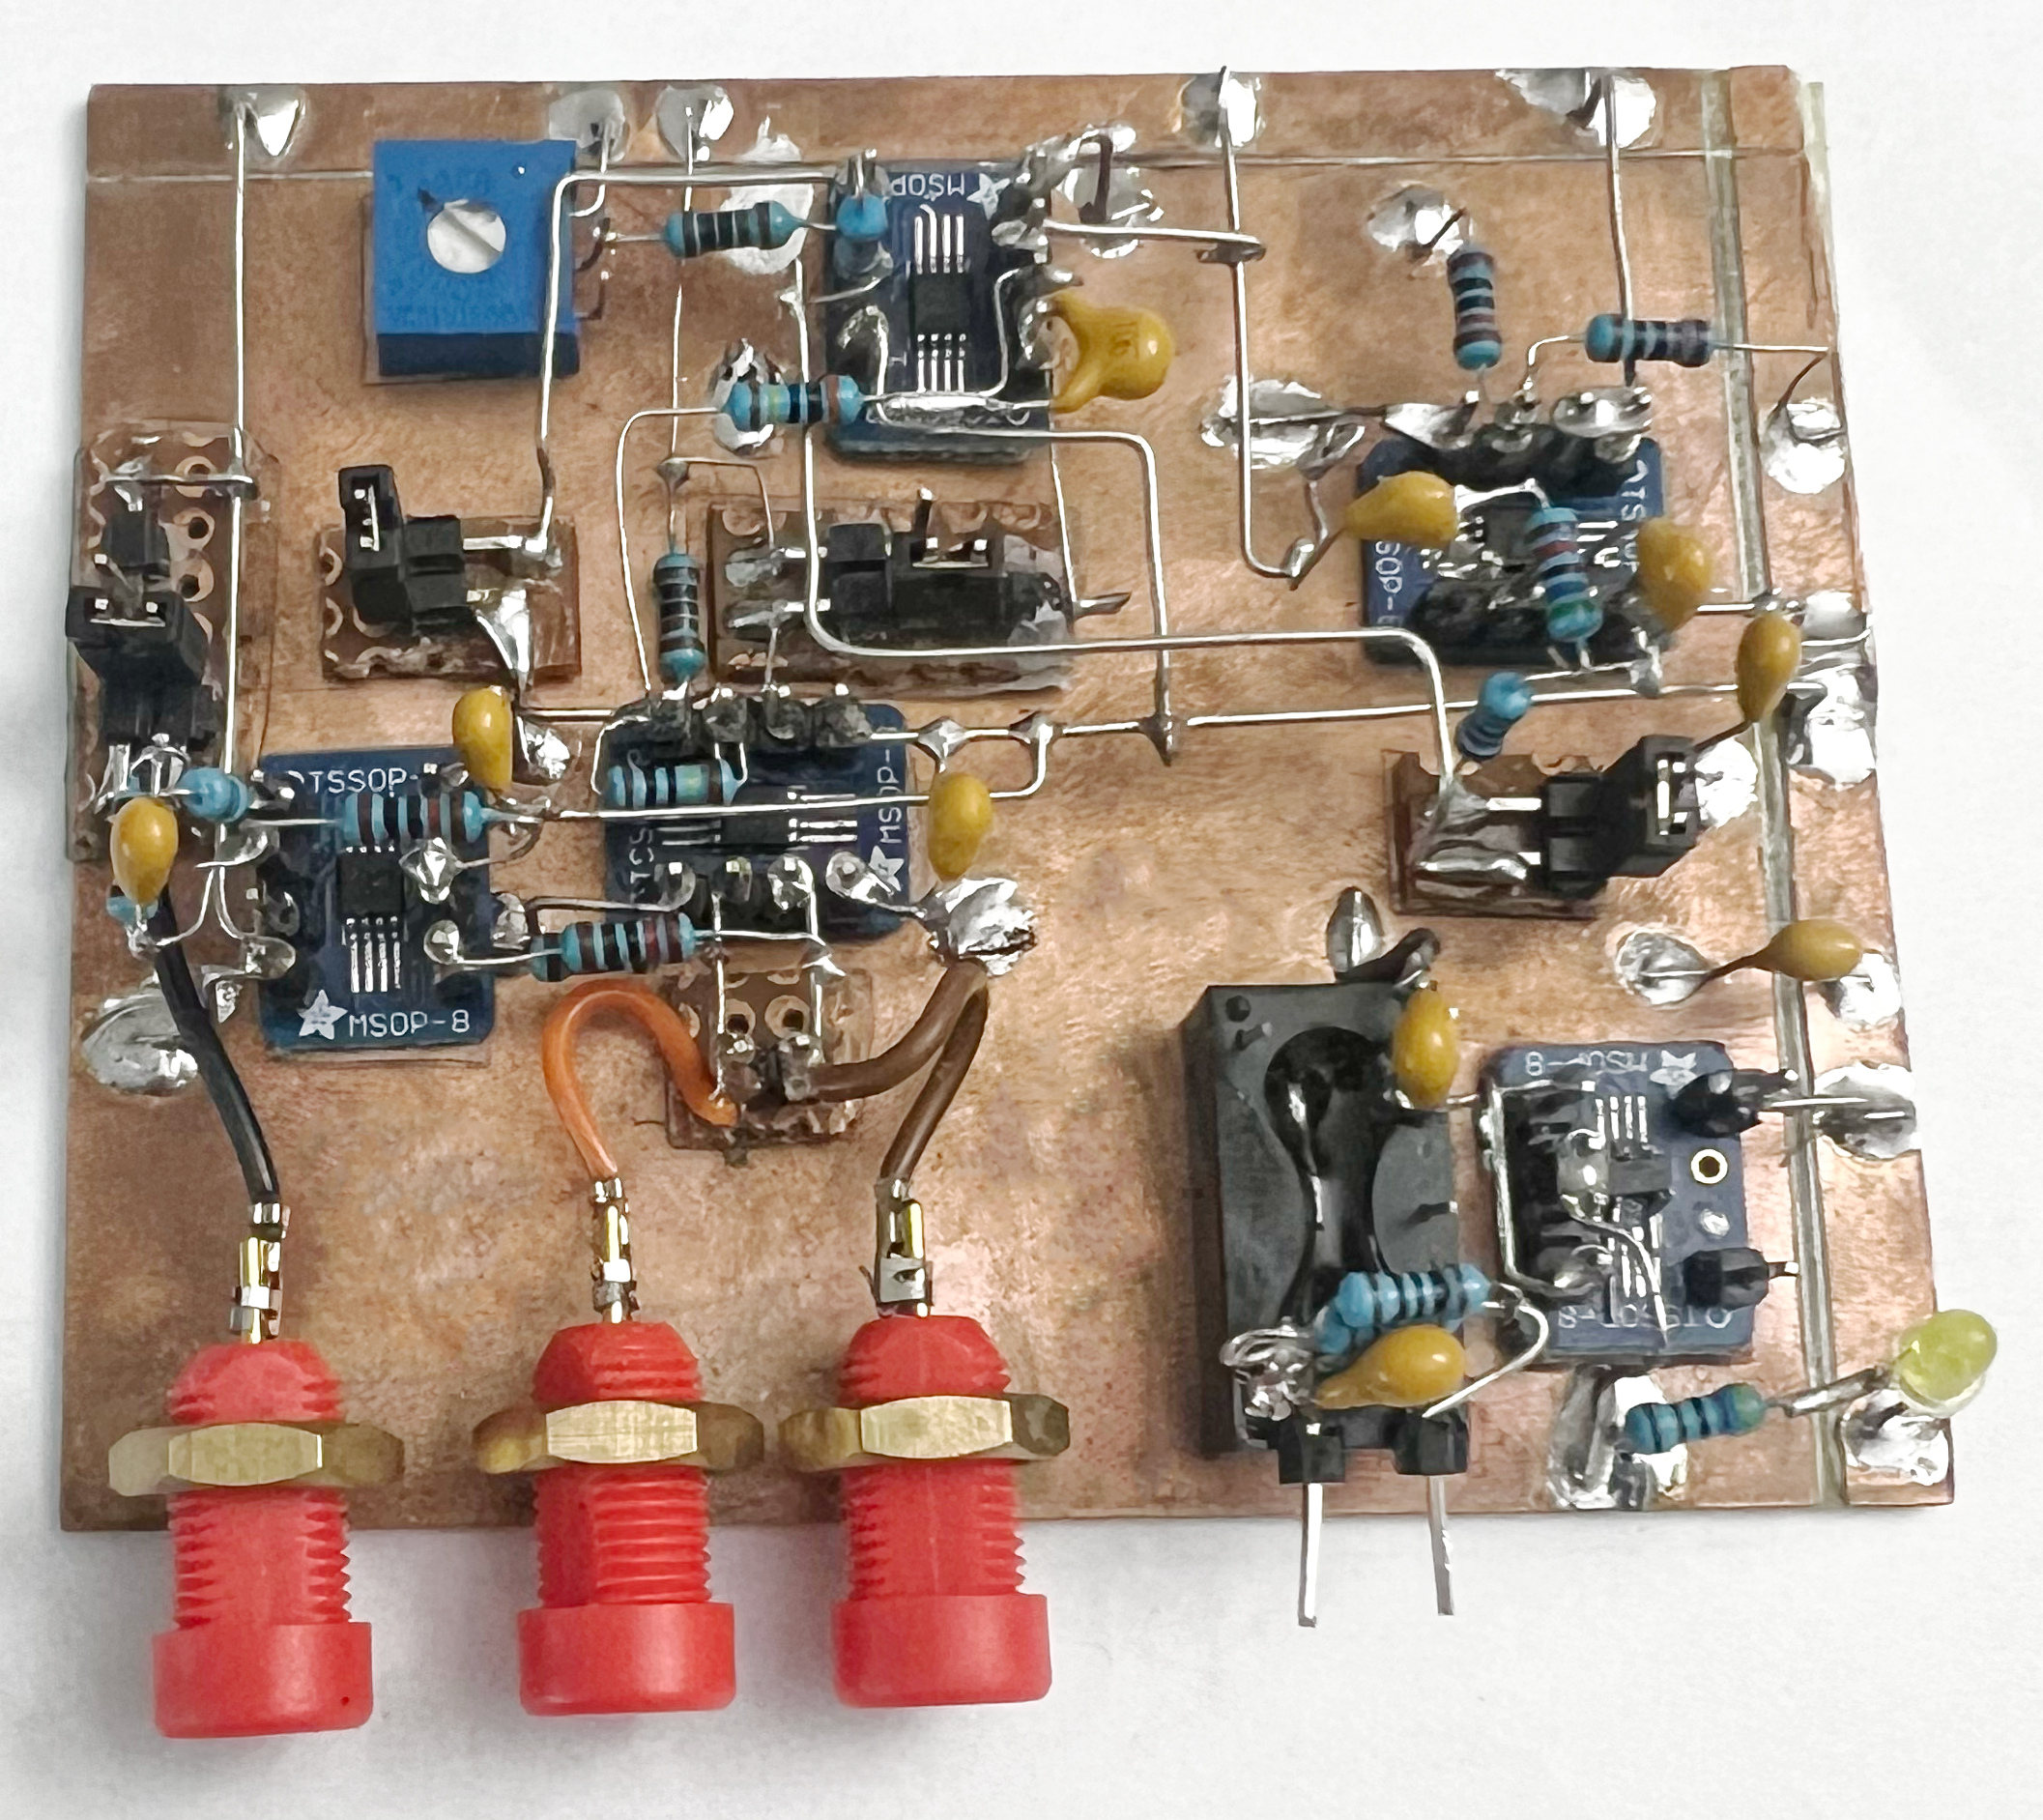
Single-channel Prototype
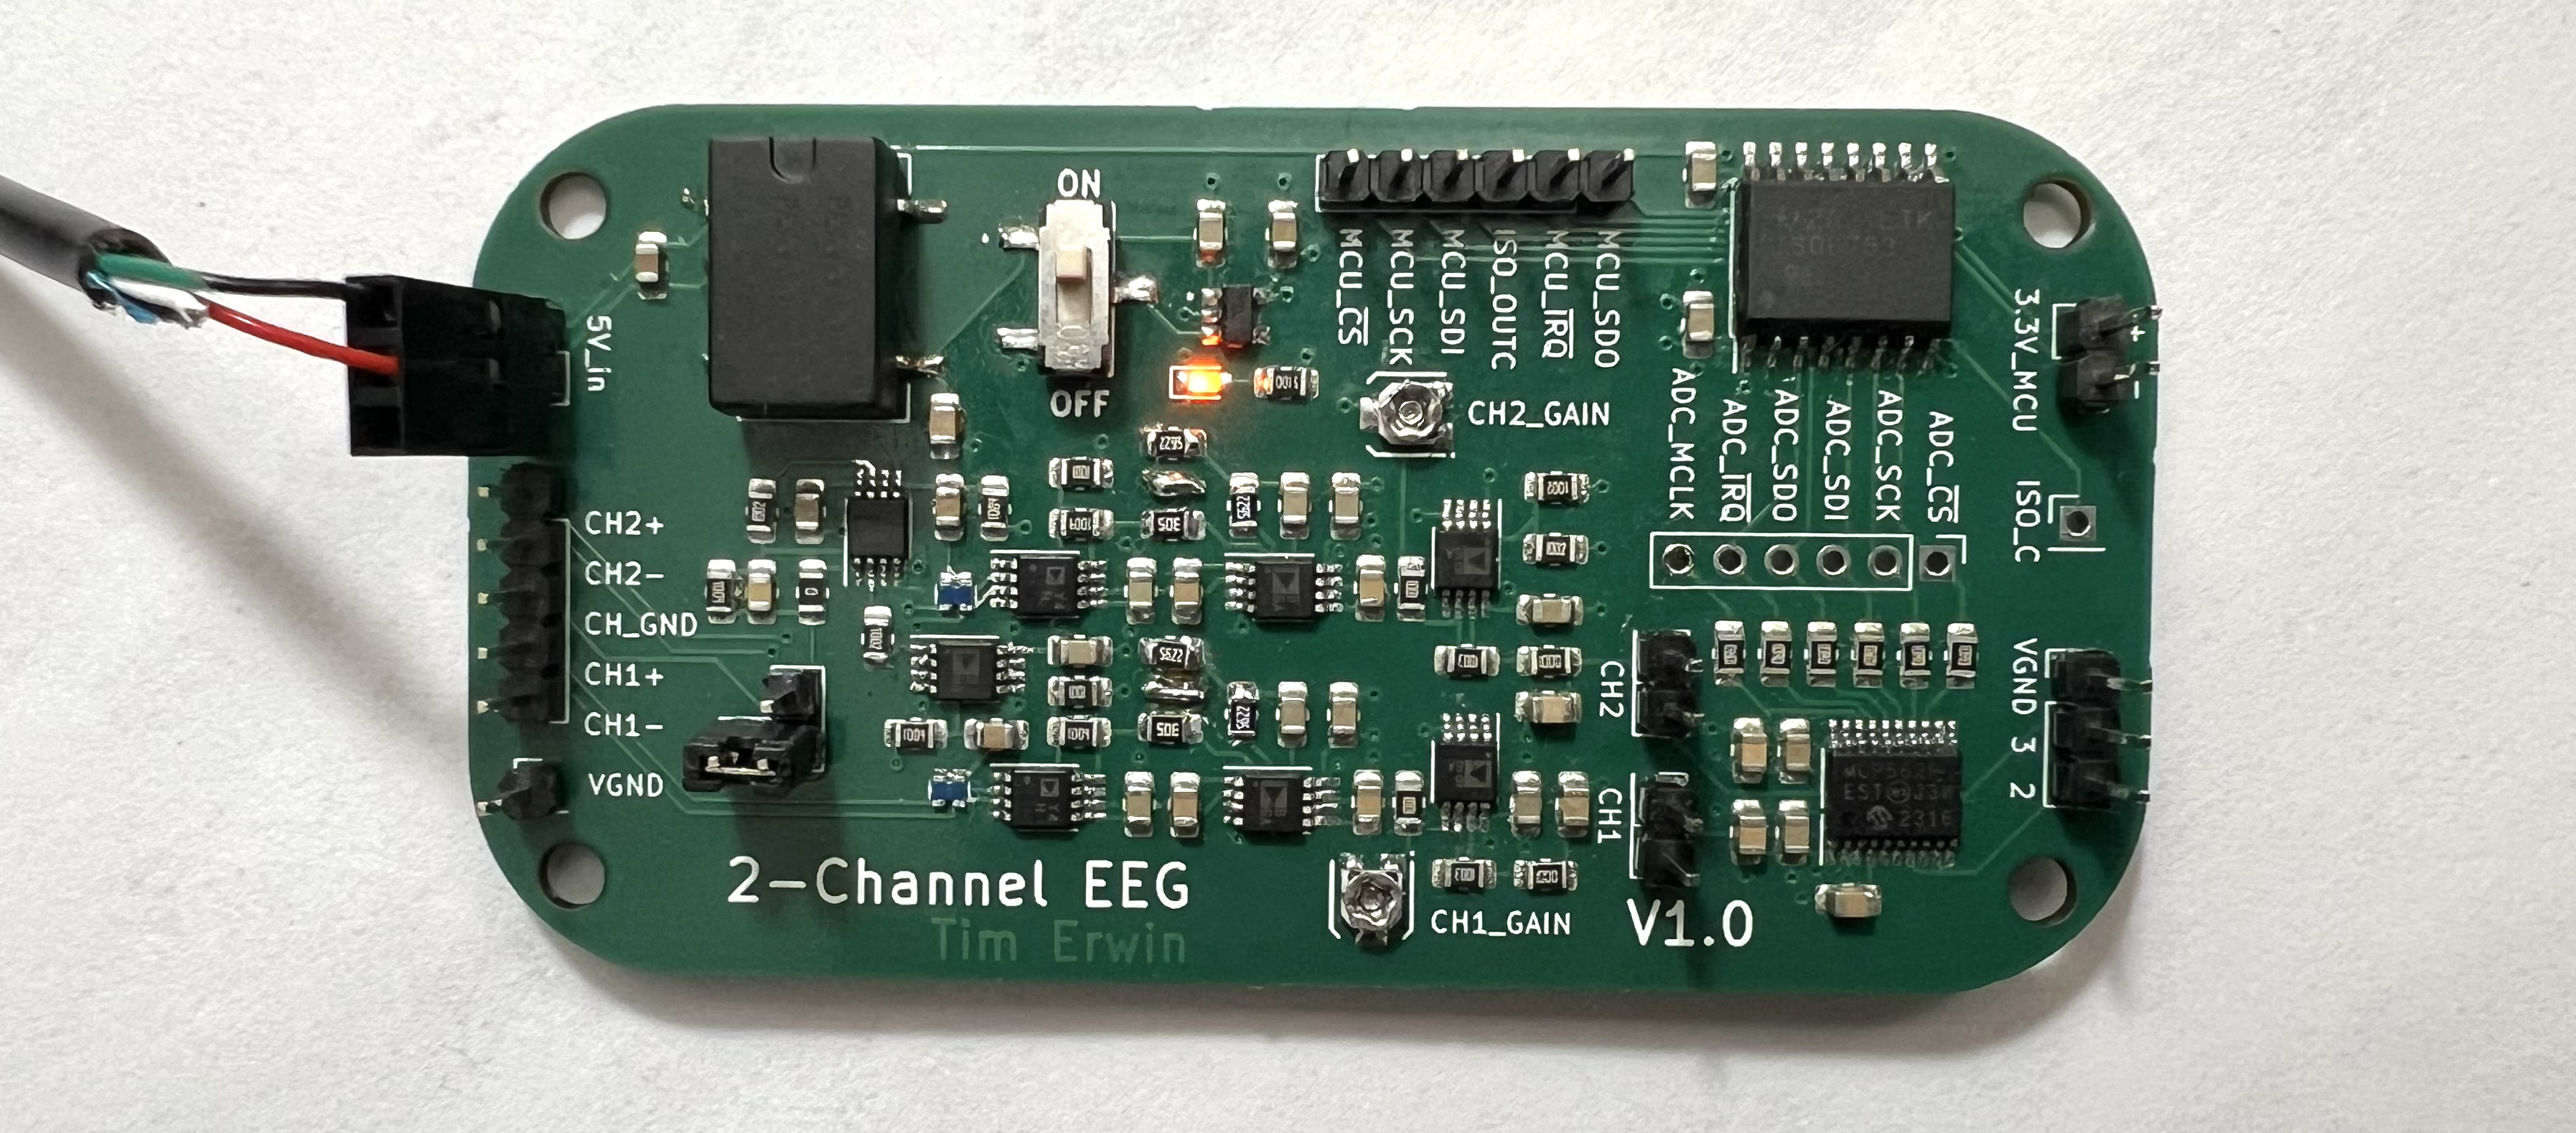
PCB Design
System PCB Schematic
Instrumentation Amplifier
EEG signals are typically measured differentially, between pairs of electrodes, to detect the difference in brain activity between two locations on the scalp. The signals are easily masked by common-mode noise, such as noise picked up from power lines, requiring a high common-mode rejection ratio (CMRR). Due to these reasons, an instrumentation amplifier (IA) was chosen as the first amplification stage. Additionally, the high input impedance of a differential instrumentation amplifier minimizes the loading effect on the scalp electrodes.
The device chosen was the AD8237 from Analog Devices, a micropower, zero drift, true rail-to-rail instrumentation amplifier. The AD8237 includes an on-chip RFI filter and ESD protection. External resistors of 1MΩ and 1kΩ set the IA gain to 1000. The output of the amplifier is fed back to the IA’s reference pin through a low frequency inverting integrator implemented with AD8606 op amps. This creates a high-pass filter and cancels the output offset, avoiding the need for large filter capacitors and resistors on the input, which can reduce the CMRR of the amplifier. It is necessary to remove any low-frequency offset to prevent the saturation of the amplifiers. This DC offset and low-frequency drift is due to polarization of electrodes and the movement of electrodes relative to the skin. The 0dB frequency of the inverting integrators was set to 5mHz, which was determined by experimentation to be effective for canceling output offset without greatly impacting the amplification of the low end of the EEG frequency range.
Sallen-Key Filter
A second-order low-pass filter was implemented in the Sallen-Key topology using AD8606 op amps. The cutoff frequency is set to 40Hz to provide significant attenuation of 60Hz noise present in the signals. The Sallen-Key topology was chosen due to simplicity and low component count.
Variable Amplifier
The amplitude of the EEG signals can vary between users and types of electrodes, so a variable amplifier is needed to tune the output of the system to stay within the full-scale range of the ADC. After low-pass filtering, the signals are amplified with non-inverting amplifiers implemented with op amps U4B and U5B. Potentiometers RV1 and RV2 are used to adjust the gain of the amplifiers from 10 to 101.
Anti-aliasing Filter
To minimize the complexity and required number of parts, a simple first-order, low-pass filter is implemented with R18, C16, R19, and C17. The cut-off frequency is set to 160Hz to avoid attenuating the high end of the EEG frequency range (around 30Hz). With this filter, some noise is detectable in the output signal up to 300Hz, so the ADC target sampling frequency is set to 600Hz to prevent aliasing. This sampling rate is only a fraction of the ADC’s maximum, making it a simpler solution than implementing a more complex higher-order analog filter to allow for a lower sampling rate.
Overall Frequency Response
After testing the individual stages described above, the total frequency response was measured to verify the required specifications. The instrumentation amplifier’s response was measured separately and then combined with the results of the subsequent stages to determine the total response. The figure below shows the magnitude response of the instrumentation amplifier, variable amplifier and filters, and the total response of channel two on the PCB. Both channels’ responses are identical. This measurement, taken with the variable amplifier set to the highest gain indicates that the total gain at the EEG frequency range is around 100,000 (100 dB) and quickly drops off to attenuate noise outside the EEG frequency range. The graph also shows reduced gain at low frequencies due to the operation of the feedback integrator of the IA.
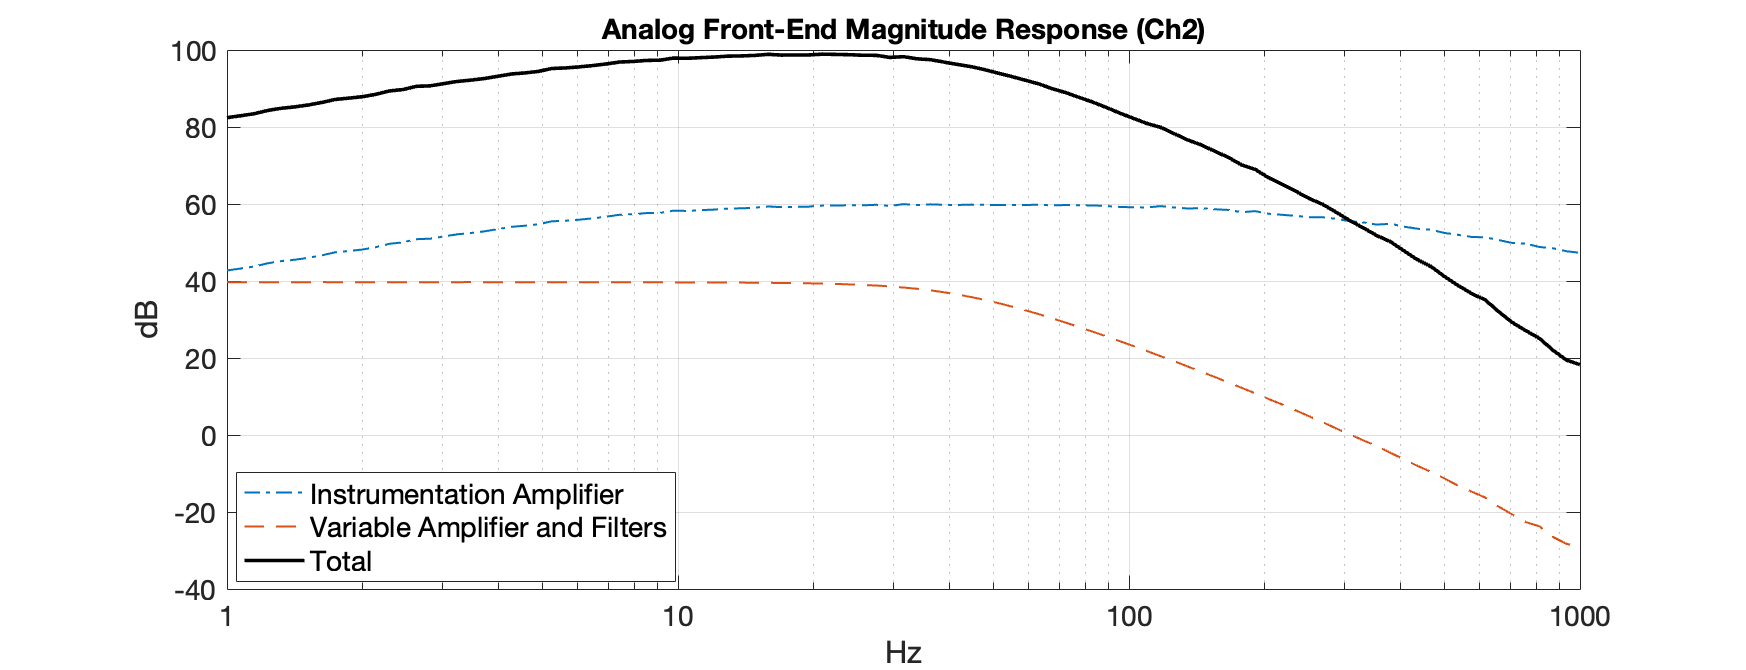
Analog Front End Magnitude Response
Driven Ground
Despite the first amplification stage’s high CMRR, 60Hz interference can arise from mismatched electrode impedances and finite amplifier input impedances, creating a voltage divider effect that causes the common-mode noise to be amplified as a differential signal. An effective way to mitigate this is to reduce the common-mode voltage present on the body as much as possible by applying an amplified and inverted common-mode voltage to the body. The common-mode voltage from each channel is captured by averaging the signals at each of the electrodes with matched resistor arrays RN1 and RN2. After averaging, the signals for each channel are high-pass filtered to remove any offset before buffering with op amps U9B and U11A, and amplifying by U9A in a summing amplifier configuration. C22 reduces the amplifier’s gain at high frequencies to increase stability if the system is ever used with active electrode cable shielding. The output of this circuit is connected to the ground electrode which is placed on the user.
After verifying that the circuit properly inverts and amplifies the average of its input signal, the circuit was tested by comparing EEG signals acquired with and without the use of a driven ground. For the test sessions without the driven ground, the ground electrode was connected to the system’s virtual ground rail. The figure below shows the relative power of the 60Hz interference for two two-minute test sessions. The relative power was calculated by dividing the power at 60Hz by the total power between 0Hz and the Nyquist frequency. A moving average with a span of forty was applied to clarify the data. The graph verifies that applying the amplified and inverted common-mode signal to the body reduces the interference by nearly half.
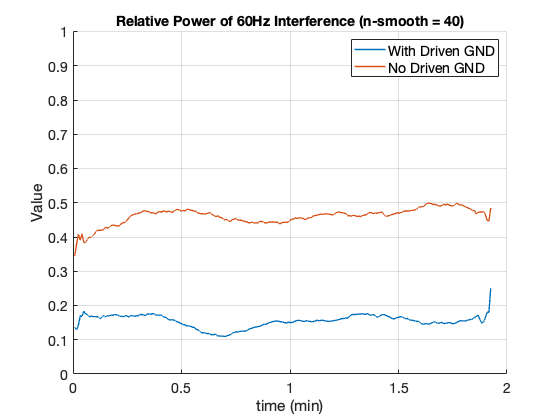
Comparison of the amount of 60Hz interference with and without driven ground.
System Enclosure
Software
Overview
The flowchart below depicts a high-level overview of the software implemented on the STM32 and laptop. The STM32 microcontroller configures and calibrates the ADC. When the interrupt signal from the ADC is detected, the latest voltage conversion is read and added to the data queue. While the data queue is not empty, ADC values are sent over UART to be read by the python script running on the laptop. The UART communication is set for a baud rate of 209700 bits per second to ensure timely transmission of data from both ADC channels. The Python code on the laptop is responsible for reading the incoming data, applying real-time filters, quantifying concentration and relaxing, and generating the live displays. To provide real-time feedback and ensure that latency is minimal, the Python code utilizes multiprocessing for the parallel execution of the data transfer, filtering, short-time fourier transform (STFT), calculations, and visualizations for each channel.
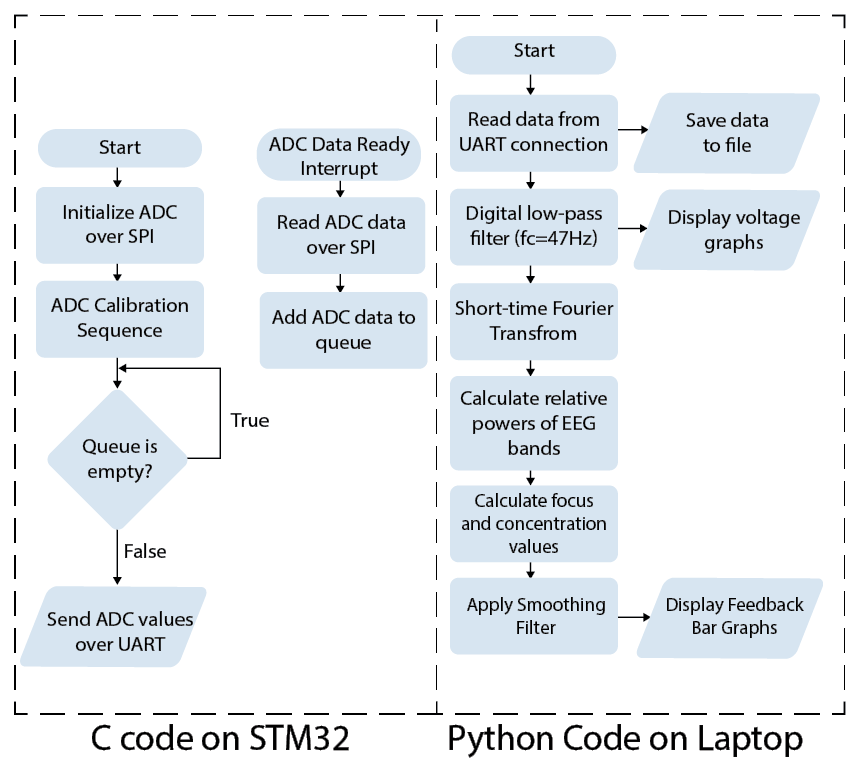
High-level software flowchart
Filtering
After the Python code receives the ADC values via UART, they are converted to voltage, then filtered to reduce noise. The graph below displays the frequency response of the filter, a Hann windowed FIR filter with a passband of 40Hz, stopband of 55Hz, and a group delay of 0.05 seconds. This filter architecture was selected for minimal passband ripple and linear phase response to minimize EEG signal distortion.
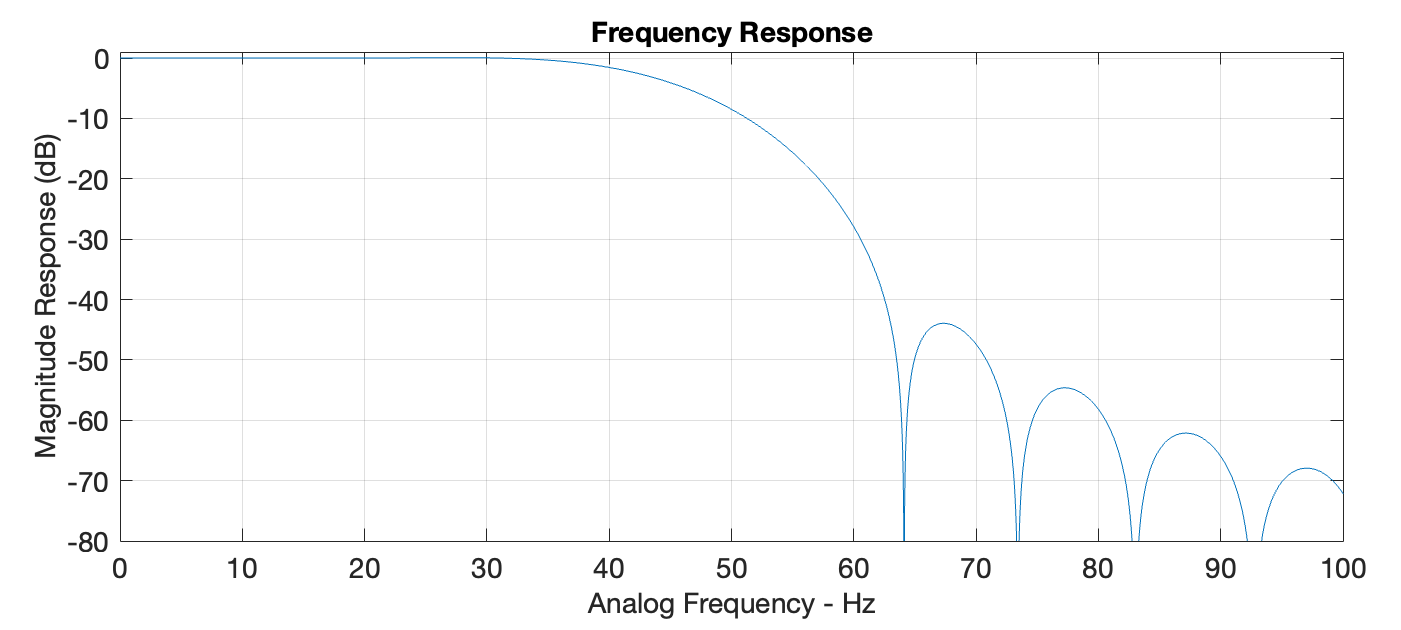
Frequency response of the digital low-pass filter
EEG Band Calculation
After filtering, a short-time Fourier transform (STFT) with a window length of one second and 50% overlap calculates the frequency composition of the signals. This window length was chosen for a balance between frequency resolution and delay. The results from the STFT are used to determine the relative powers of each EEG band. The system displays these relative powers, along with relaxation and concentration values. Relaxation is calculated by dividing the sum of the alpha and low beta power by the sum of high and mid beta power; concentration is the inverse. Each of these 30 values are scaled by a constant to be less than or equal to one, based on a calibration session with the user.
Real-time Feedback
Once the electrodes are set up and the program is started, the real-time visual display begins. Due to the STFT window and overlap length, the bars depicting the power of the EEG frequency bands, concentration level, relaxation level update every 0.5 seconds. Data for both channels is saved in a file for offline analysis of the session’s results.
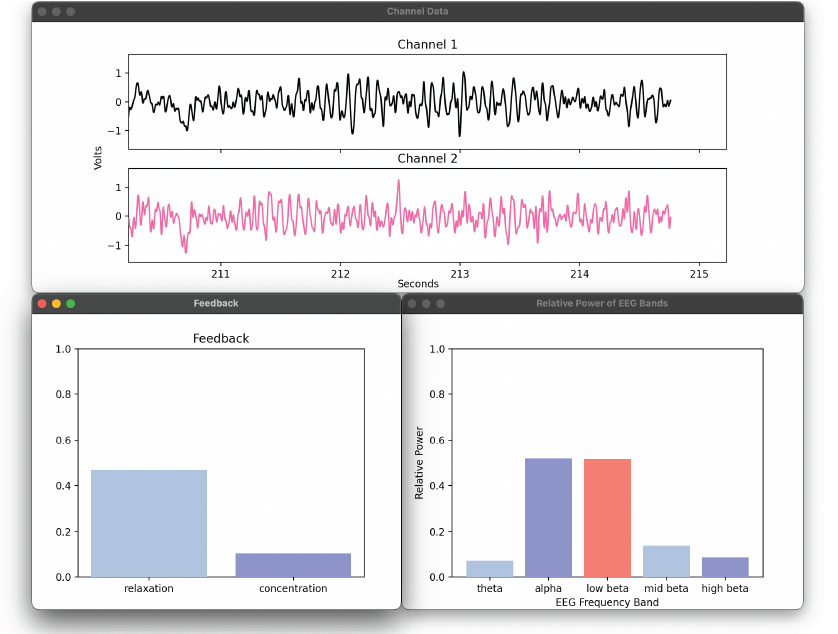
Screenshot from the real-time visual display
EEG Experiments
To verify that the system is acquiring and amplifying brain activity rather than random noise, several signal characteristics were observed. When someone is relaxed with eyes closed, alpha components dominate, and their amplitude decreases significantly upon eye opening. The figure below displays a spectrogram of a three-minute test session: the first minute with eyes open, the second with eyes closed, and the final minute with eyes open. During the closed-eye period, the alpha amplitude increases, indicated by a color change in the spectrogram, confirming the system detects expected brain activity changes.
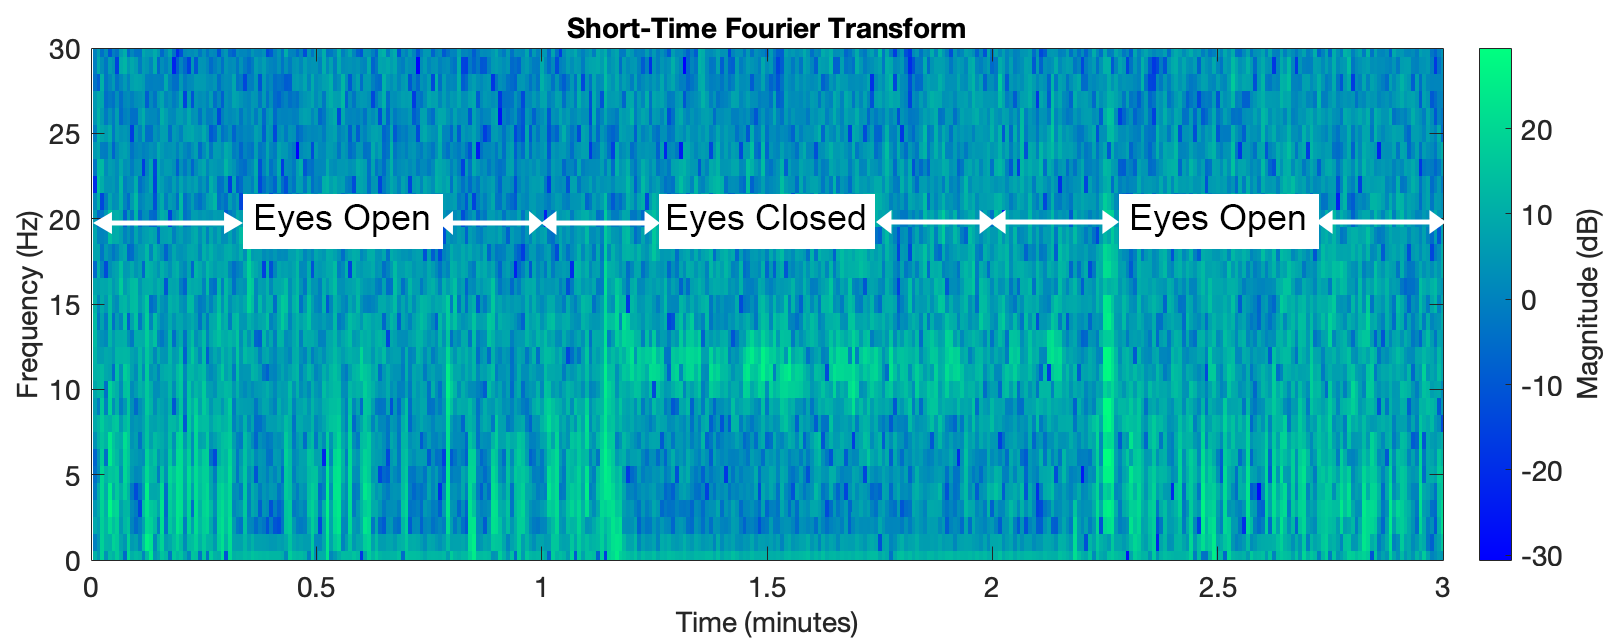
Spectrogram showcasing an increase in alpha when eyes are closed.
Additionally, the presence of blink artifacts indicates proper signal measurement. Electrodes near the eyes detect a large voltage swing during a blink, due to the eye being a dipole. An example of a blink artifact is highlighted in the figure below. These artifacts also appear as low-frequency spikes in the spectrogram during eyes-open periods.
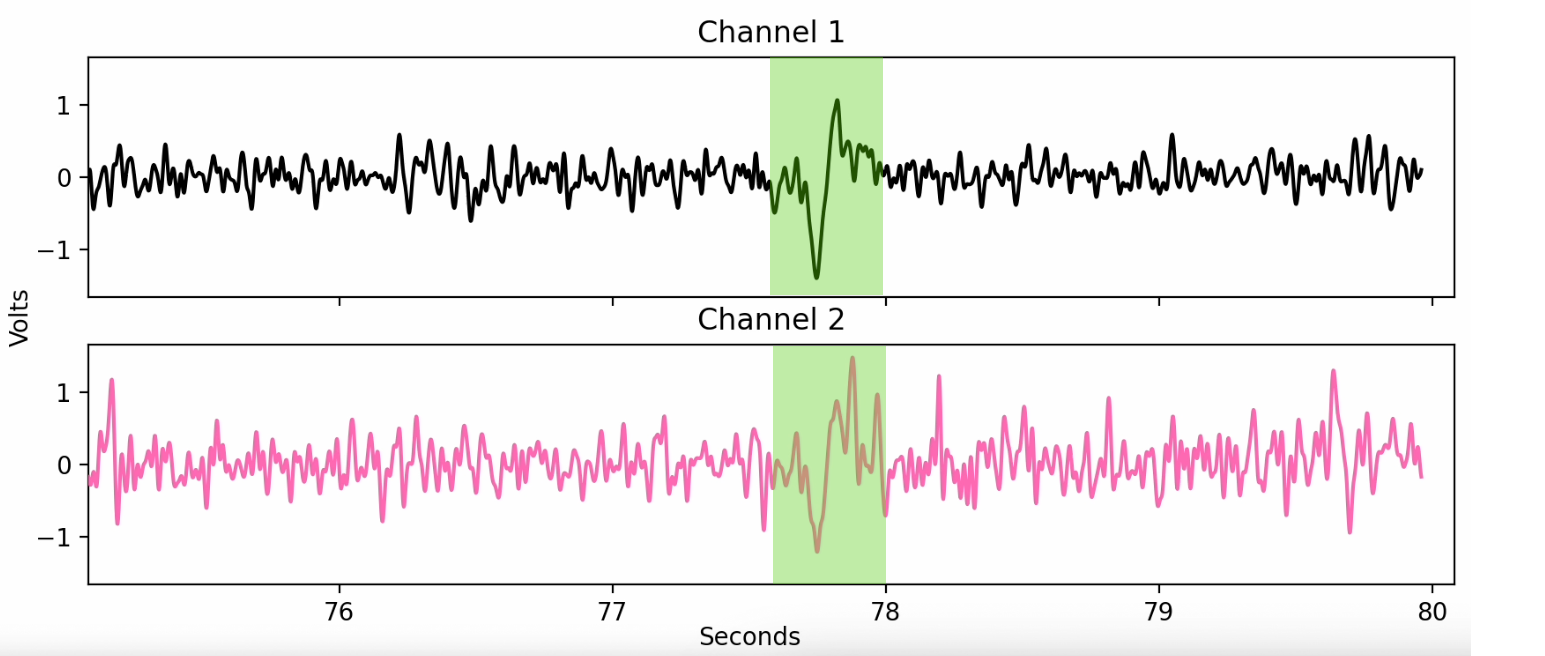
Example of a blink artifact (highlighted)
Test sessions where the user tried to focus or relax were conducted to verify that concentration and relaxation values could be approximated using EEG frequency band power calculations. From these experiments, it was concluded that it is possible to observe differences between concentration and relaxation using alpha, low beta, mid beta, and high beta. The graph below shows the results of a twenty-five minute test session: five minutes reading and trying to concentrate, ten minutes of relaxing with eyes closed, and ten minutes of reading again. A moving average with a span of forty was applied to clarify the data. The figure shows that the concentration value is highest with the greatest variation during the reading period, and the relaxation value is highest with the greatest variation during the relaxation period.
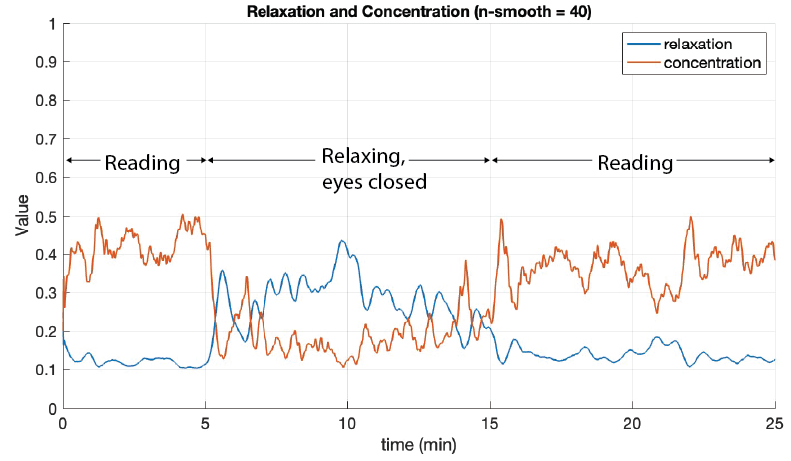
25-minute test session involving reading and relaxing
Conclusion
This project successfully met the requirements of recording a user’s brain electrical activity and providing live feedback on concentration and relaxation levels through spectral analysis. The data gathered by this 2-channel EEG system is only enough to provide an approximation of the user’s mental state, and further modifications to the system to improve accuracy could include adding more channels for more detailed data capture, utilizing spatial analysis in addition to spectral analysis, and machine learning methods. An improvement that could enhance user comfort and reduce setup time could include incorporating active electrodes that buffer the signals captured on the scalp to allow for the use of dry electrodes.